
Recently I finished an Arduino-based temperature logger. I have heard folks speculate why the air might be better some days than others. I was curious what effects air temperature would have on flying and air stillness. Others have used wireless infrared thermometers to get spot temperatures on surfaces, however these don’t log temperatures over time, nor can they tell you anything about the air temperatures at different levels below the ceiling.
I made the cable for this specifically long enough to reach the ceiling at West Baden, originally for a different sensor type. I wanted to measure at the ceiling and at the floor, plus at some level below. I didn’t really have any idea where this middle sensor should be, so I made connection points at 5’, 10’ and 20’ below the top figuring I could move the sensor as needed to capture the data. These seemed quite reasonable places for where I do most of my flying, Racine (42’), Oshkosh (43’), and Rantoul (44.5’).
As I tried this sensor package out on a prototyping board, it became clear that the sensor had some serious issues with drift over time, ending up several degrees apart over the course of six to eight hours. The code was also buggy, often crashing after only a few hours. I moved to a different sensor type and discovered that while two ran consistently higher than the others, they had no drift at all. Additionally the code for the sensors was more stable, crashing less often to the point that I could run the data collection for several days at a time. This allowed me to build up a large amount of data and pinpoint a reliable correction factor for the two sensors. I also realized that I could utilize the cable I had already made and capture the data at all five points with only slight modifications.
There is one issue with this approach – It is a cable that hangs down. No matter where you put it inevitably models will find it. Additionally you are only going to get data from that column and that column may not be completely representative of the air conditions in a large space. There is a large break in the data on Sunday when the balloon was moved inward towards the edge of the dome, out of the traffic that was developing in the airspace above the data logger as conditions improved dramatically. The data will show why.
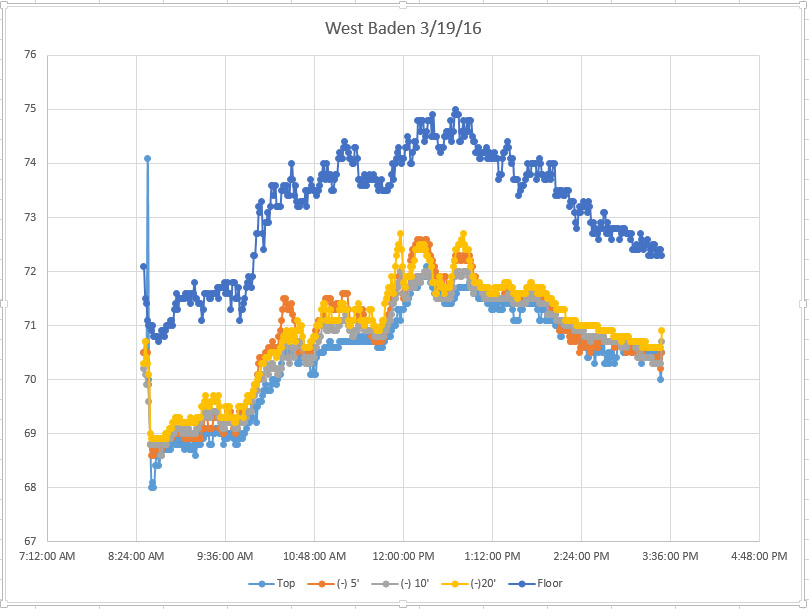
Saturday, March 19th 2016
Conditions outside were cold, about 38 degrees F, windy and it rained most of the morning until sometime after lunch. It was very overcast all day, dark and dreary weather.
Inside the atrium, conditions were the worst anyone had ever seen. The floor temperatures were significantly warmer than at the ceiling. The center of the room was turbulent and mostly down drafts all day long. At the edges of the building, there was a small updraft. In essence, we had a torus-shaped reverse thermal going on all day long. The data supports this very well, showing how the air would cool as it rose, then fall in the center. We can also see that the air from the top to -20 feet is remarkably homogeneous, varying by only 0.5 degree F over the bulk of the day.
Leo Pilachowski notes that windows meant to cover the air handlers on the second floor about the lobby entrance were open and a draft was present all day. This would contribute to the turbulence noted down low, especially around the hotel lobby entrance.
Note: Times on the graph to be offset by one hour due to Eastern Time Zone rather than Central as set.
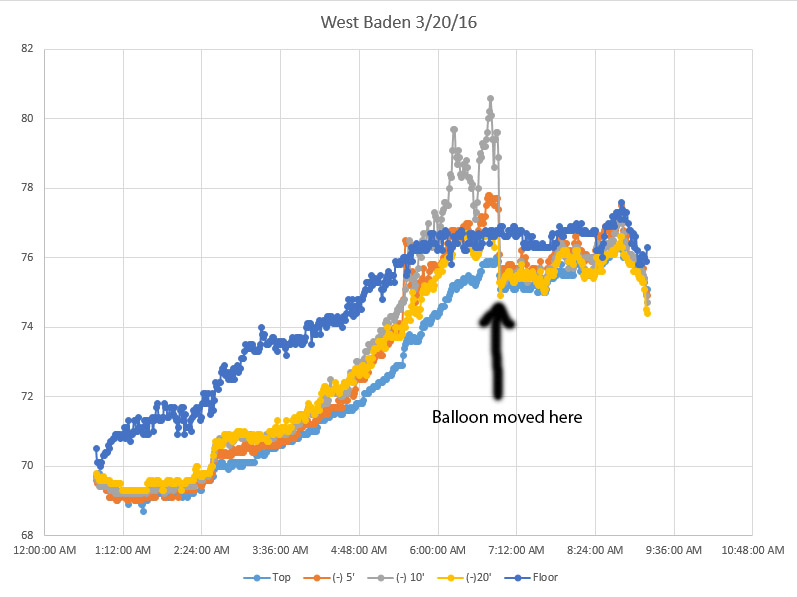
Sunday, March 20th 2016.
Conditions outside were still cold, but less windy and no rain noted. Rather than being dark and dreary, it was merely overcast and perceptibly brighter inside the atrium. As the day progressed, the overcast broke up and it became partly cloudy and significantly brighter. At some point around noon, the sun started shining brightly, blue skies and clouds.
Inside the atrium, conditions had improved in the morning, but were still not good. There were still significant down drafts in places. As the windows Leo had tracked down were now jammed shut, the turbulence down low was still present but significantly lessened. Around noon as the sun came out, you can see significant warming in the air up high. At around 1pm the temperatures equalized with the floor and the air became significantly better. Somewhat unfortunately it became better right where my sensor was and I had to move it out of the traffic pattern. This move lowered the height around 5 feet and moved the sensors out towards the wall approximately 11 feet. The data shows that I moved it out of the warm air ‘bubble’ in the center of the atrium.
Note: Times on graph are off due to failure of Real Time Clock, but correspond to roughly 8:30am until 5PM EST.
Height calculations for Saturday:
Top sensor was at 95’2″ and approximately 32′ from the edge of the atrium.
When moved inward on Sunday, height was 90’1″ and 21′ from the edge.
“Weather Balloon” location inside the atrium. Photo courtesy of Allen Burnham, used here with his permission.
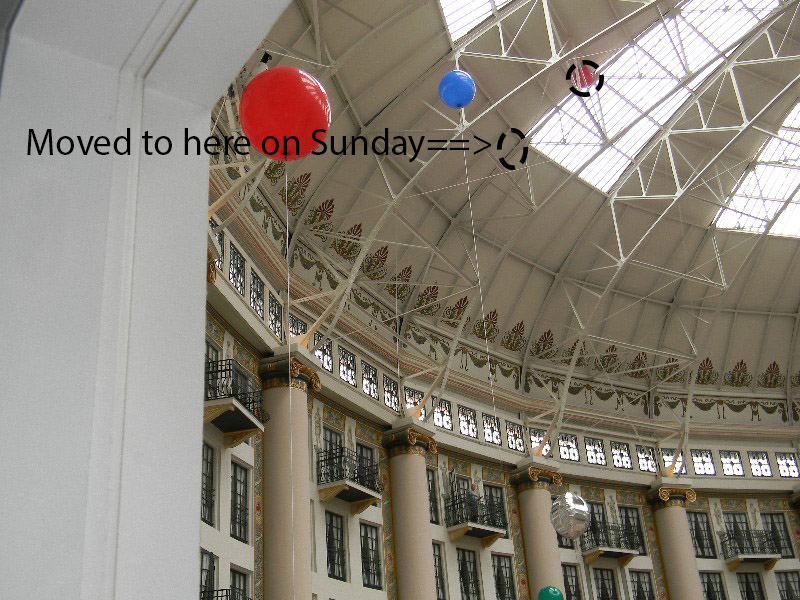
Picture showing locations of balloon for data capture. Photo by Allen Burnham and used with his consent.
Links to plans for the atrium structure can be found here:
http://www.loc.gov/pictures/item/in0122.sheet.00008a/resource/
and here:
http://www.loc.gov/pictures/item/in0122.sheet.00002a/resource/


Leave a comment